


Case Study #3: Classroom Comparison
Many schools include more than one section/classroom teacher per grade. In these cases, it can be insightful for school-level administrators to compare the summaries across classrooms. There is an inherent sensitivity to using assessment data for this purpose, and these comparisons should be done with careful consideration of the factors used to determine which students were assigned to which classrooms. If you are administering the Iowa Assessments early in the fall, most student growth happened during the prior year in a different classroom. Assuming an equitable and consistent means of assigning students to different sections, a comparison like the one below in Figure 8 can be particularly insightful. The first graphic below shows the summary that we reviewed in Case Study #2. The second graphic is for a second classroom of fourth graders, which contains the exact same cohort of students from their third grade section.
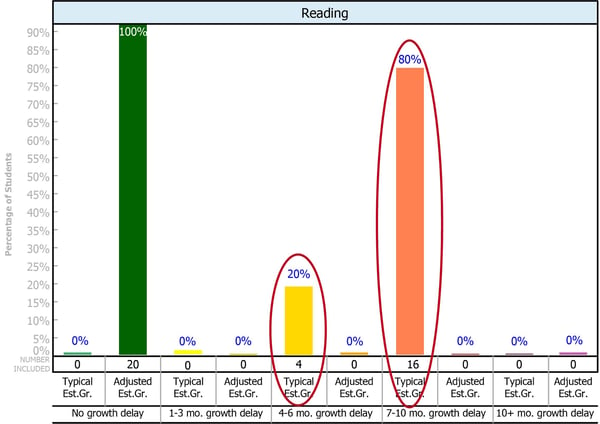 Figure 8
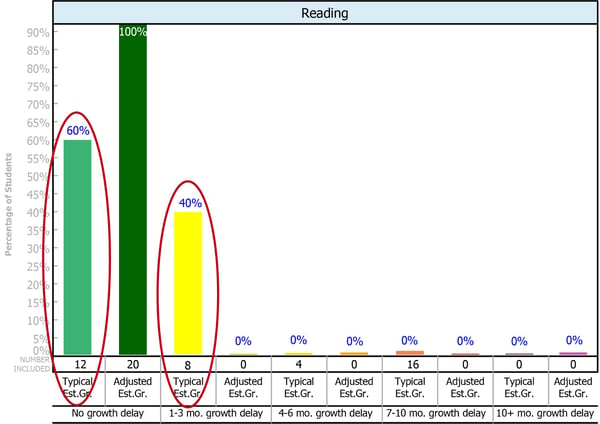
Figure 8-2
Can you interpret the difference in the results?
First, you can see that 100% of students in both classrooms had “No delay” when their growth estimate is adjusted for school closure (second bar in each graph). That is an immediate positive. However, you can also see the disparity in the number of students that showed no delay compared to the growth expected in a typical school year. 60% of students from the second classroom continued to grow at the rate of their peers across the nation for a typical school year, compared to 0% from the first classroom. Of the remainder of students from the second classroom, 40% were delayed by 1-3 months. Comparing that with the first classroom, 20% were delayed 4-6 months, and 80% were delayed 7-10 months.
These differences should stimulate the question “what was different about the experience of students in the second classroom?” Was there an approach to virtual learning that was leveraged differently that lent itself to more students staying on track as if school had never closed? Were there different materials or programs used? Was one classroom teacher very familiar with technology and comfortable using it, and the other not as much? The data certainly suggests that the growth outcomes were at least partially dependent on the classroom to which students were assigned.
Case Study #4: Grade-level Comparison
Now that we have established the interpretive framework and processes for ruling out unrelated factors, you can leverage the same approach to other types of group comparisons. Figure 9 shows a comparison of Grade 1 to Grade 8. It reveals a dramatic profile that should prompt you to think critically about the impact of school closure and relative success of virtual learning for younger students compared to older students. The Grade 1 summary shows that 90% of these young students were delayed greater than 10 months compared to the growth estimated in the typical school year. Even when estimated growth is adjusted for early school closure, 65% are delayed more than 10 months and 20% are delayed 7-10 months. This data indicates that there was a fair amount of learning regression for the young students.
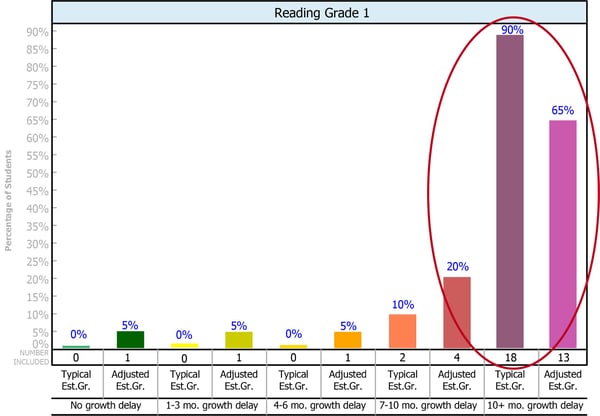
Figure 9
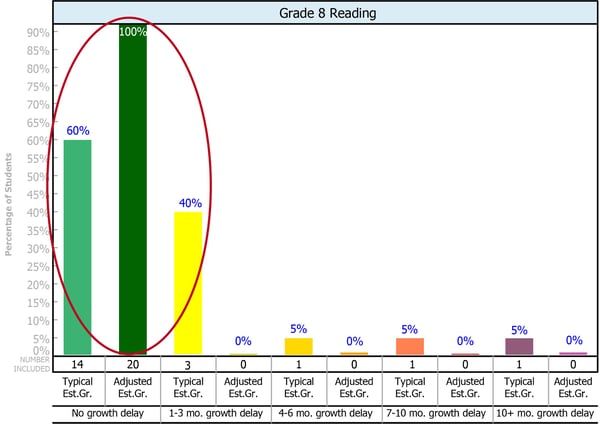 Figure 9-2
The Grade 8 profile reveals quite the opposite. 60% of these older students showed no delay from estimated growth in a typical school year, and 100% showed no delay when their estimated growth was adjusted for early school closure. In practice, you can review data for age trends to see if there is consistency across schools or across other grades. Would this trend hold true if you looked at Grade 7 compared to Kindergarten?
Case Study #5: Content Area Comparison
For this next comparison, we will use the same Class Roster report that we used to compare Mia to her classmates. We applied a new filter, so you can now compare Reading and Math. Figure 10 shows consistency in the growth outcomes between the two different content areas. While Marissa’s delay in Reading was a little more than in Math and Mike’s delay in Math was a little more than in Reading, the data are consistent. No students were delayed in either content area when estimated growth is adjusted for school closure.
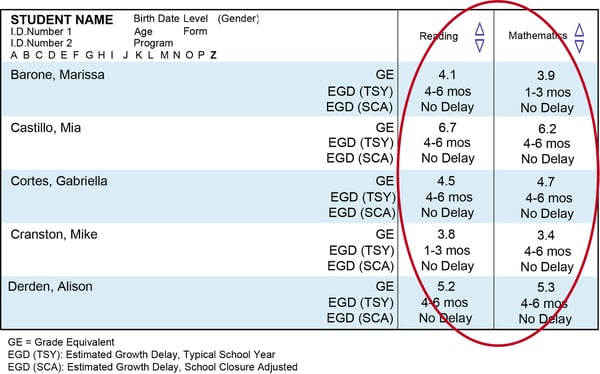 Figure 10
If this trend remains consistent for all grades and schools in your district, you may conclude that the impact of school closure on student growth and relative success of virtual learning programs was not dependent on the content being taught.
This framework for comparing groups can be extended to other types of group comparisons such as between schools or across subgroups.
Where Are We Now is the next and final segment in this series.

.jpg)