
It’s time to take a fresh look at all the ways CogAT® helps us understand student ability and potential for learning. The new CogAT Dashboard arrives just in time for back to school this year and grants all educators (not just those involved in Gifted & Talented programs) easy, interactive access to their CogAT data to quickly gain insights on how best to help students learn. After all the disruption we’ve experienced this year, this is especially important. The dashboard is the tool you need to make the unique benefits of CogAT work for every student in your system. And the best part – the dashboard is available to you now in DataManager.

The CogAT dashboard delivers interactive views tailored to drive insights relevant to stakeholders within your school system including:
-
- District administrators
- Principals and building administrators
- Gifted and Talented program coordinators
- Classroom teachers
The dashboard has tools designed specifically to enable educators to use ability data easily and with flexibility as they make important decisions about how best to serve students. Multiple views are provided from a single screen, with interactive drill-down functionality and multiple toggles that make clicking through your data a breeze.
We know that identification for Gifted and Talented programs is one of the most common uses of CogAT data. With that in mind, the new dashboard offers functionality that enables best practices in terms of setting criteria and balancing equity in identification. The cut score selection tool allows program coordinators to examine the effects of different cut scores in just a few clicks, helping to answer questions such as:
-
- How many students will qualify?
- What is the effect by subgroup and for students in special programs?
- How is my identification matrix affected by looking at individual Batteries vs. Composites?
- How do cut score combinations affect the diversity of our talent pool?
- Once students are identified for our district-level programs, which criteria best serve our building-level programs?
- Should we use different cut scores by building?
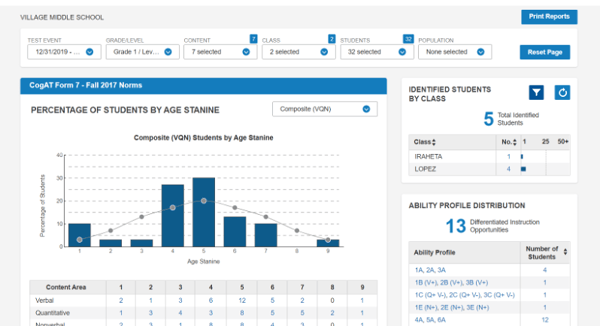
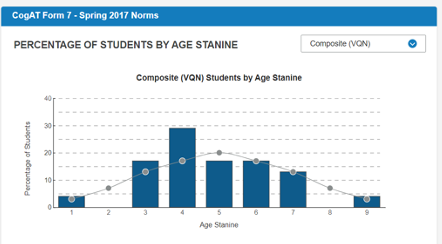
However, CogAT is far more than just a tool to select students for accelerated academics. The CogAT dashboard will help your school system use ability data more broadly. If CogAT scores have solely been in the realm of the Gifted and Talented team, the dashboard can facilitate conversations between G/T program coordinators and educators in other departments, because it makes ability data so accessible. For instance, the dashboard easily summarizes information about overall student performance so that district and building leaders can easily see the story that your CogAT data tells to intuit, frame, and answer questions they didn’t know they had – or that they didn’t know CogAT could help to address. For instance, the dashboard’s stanine chart can be used to quickly highlight differences in performance by building.
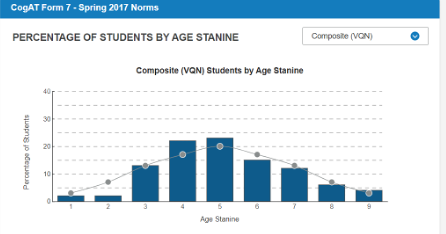
The value of ability data is not limited to highly able students. Visually comparing the graph for the district overall (left) to that of a single building (below) helps us see at a glance that this building is slightly lower performing on average than the district. However, there are also groups of students at the high and low ends of this chart whose needs are different. Who are these students? Do they need further evaluation? Simply clicking on the chart brings up a list of the students in each group so that the building principal and instructional coaches can make plans that serve all students appropriately.
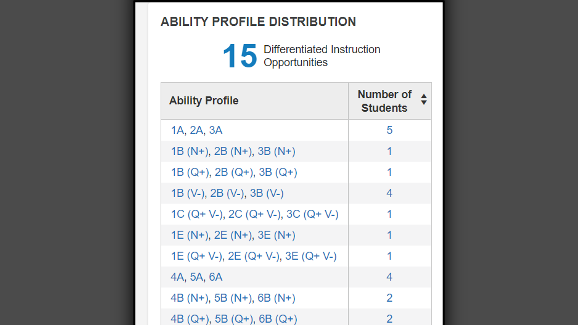
The CogAT dashboard has valuable information for classroom teachers too. The Differentiated Instruction Report offers valuable insights to drive classroom instruction and planning. By linking directly to student Ability Profiles, the dashboard provides a summary chart and report (below) for instructional guidance – this is the functionality you’ve been asking for! This feature offers a new way for teachers to engage with their students’ ability data in the classroom to inform the pace of instruction, complexity, and degree of structure that will be most effective for individuals and groups of students.
Want to learn more about the reporting tool that helps educators to better engage with the rich data that CogAT provides? Watch the demo below of the CogAT dashboard with author of CogAT Form 8, Dr. Joni Lakin, and Riverside partners to see how the this tool can elevate your ability insights and applications.