
It is no secret that the COVID-19 pandemic had a profound impact on student learning. Current research indicates that students are not yet achieving as well as they were in math and reading prior to the pandemic; additional learning and further interventions are needed to help students overcome the learning loss. It is up to educators everywhere to do their part in getting students back to where they should be.
Different Ways to Observe Learning Loss
Below are visualizations of student growth over time. The following four graphs depict four possible predicted learning growth paths regarding recovery from pandemic learning loss. On the following graphs, the black dots depict students' expected learning growth over time in normal learning circumstances. In other words, it is baseline student data and the projected learning trend without the influence of a pandemic. The red dots depict predicted learning growth in terms of recovery from the pandemic under four scenarios.
1) No Recovery

The first scenario pictured represents the learning loss that occurred due to the pandemic and no recovery to where learning levels should be. The lost ground due to COVID is not made up, and learning loss continues as student performance proceeds to drop; students aren't catching up. This is a system in significant trouble.
2) Some Recovery

This second scenario represents the same learning loss as a result of the pandemic but with students learning in school without interventions in place. Notice that growth is improved. However, the improvement is still not closing the gap to where learning levels should be. This is a more hopeful scenario, but it is not a recovery; there is much more work required.
3) Slow Complete Recovery
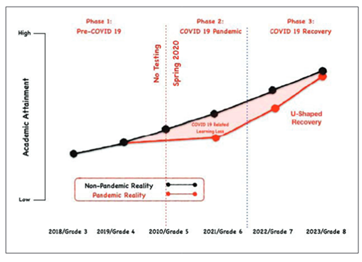
The third scenario depicts a gradual recovery to near pre-pandemic learning outcomes over the course of three years. This is a hopeful scenario, as students are eventually catching up to where they would have been had they been receiving normal in-person instruction.
4) Quick Complete Recovery

Lastly, this fourth scenario represents a quick recovery to pre-pandemic learning levels. The learning loss was experienced over the COVID distanced learning period but upon returning to school, learning was accelerated and students were able to catch up. This is a very hopeful scenario as a quick recovery is made to expected learning levels.
Why Track Learning Recovery?
In recovery of students back to expected learning levels, it is important to document the rate of recovery by analyzing changes in learning trajectories (both level and slope), as initiatives related to pandemic recovery are implemented. These initiatives consist of offering incentives, doing professional development, mentoring, conducting tutoring programs, having after school learning initiatives, summer school programs, or anything else to help students catch up. To see how recovery is affected and if students are in fact catching up, a comparison is needed between the students who are receiving the initiatives to the students who are not. This allows you to analyze the impact of district initiatives on learning trajectories of students. If students are showing greater growth than expected with a particular initiative, you are able to see that the initiative in place is effective. It is also crucial to look at various student groups (EL, homeless, disabilities, 504 plans, etc.) to make sure all students are benefiting from the district's offerings.
How Can Student Growth & Recovery Be Measured?
The easyCBM® Benchmark Grade Level Score report provides the ability to compare your students' risk level in meeting grade level standards across the 3 benchmark assessments. For example, in looking at word reading fluency, you can see raw scores, percentile ranks, and where students fell in terms of the national norms of word reading fluency. In comparing the color-coded scores across the benchmark assessments, are students showing less at-risk? Are the students' scores improving? Examining the "growth" column provides the raw score growth between benchmark administrations. If students scored below grade level on the fall benchmark, scores in the some and low risk categories will show they are improving over time.
Changes in the student's level of risk towards mastery of standards is viewable within the Risk Analysis report and the individual student Multi-Year Benchmark History report. Both reports allow you to identify the positive impact of interventions in place. Further, the Individual Student Report documents the student intervention(s) in place, allowing for the ability to discuss with administrators, teachers, and parents the effect of the interventions and whether or when a change is needed.
How Can the Rate of Recovery Accelerate?
Supporting students with accelerated learning recovery involves knowing each student's specific skill deficiencies, providing focused instruction on mastery of such skills, and assessing skill mastery. After administering one of three benchmark assessments in easyCBM, review the column "Suggested Progress Monitoring" to identify the progress monitoring probe(s) to administer according to the skills missed, and the frequency for administration. Analyzing item-level reports also provides the areas of skill weakness. Through differentiated, targeted instruction on the specified skills identified, students can work towards standards mastery. Following instruction and with needed interventions in place, administer the identified probes within easyCBM. Documenting within the easyCBM platform the interventions, instructional goals, and probes administered will quickly show each student's rate of growth towards recovery. After reviewing the scores and making any needed changes, continue to progress monitor prior to the next benchmark assessment.
Learning loss is still evident among students, and the initiatives in place should match student academic needs in area of support, time, curriculum, and student population. It is an ongoing process where you must have access to sufficient data: historical data documenting learning in the past, as well as current data to document learning growth. With easyCBM® reports, you can quickly compare how students are doing based on risk in meeting grade level standards. easyCBM® can document the learning loss as a result of the pandemic and more importantly, guide your recovery efforts.
Watch easyCBM author Dr. Julie Alonzo discuss these recovery scenarios and show how to interpret data from your easyCBM reports to help get your students on the path to growth.