
It is no secret that the COVID-19 pandemic and remote learning had a profound impact on student learning. With the return to in-person instruction, it is of paramount importance we address these potentially lasting impacts. With huge learning loss evident, significant learning recovery efforts are necessary. It is up to educators everywhere to do their part in getting students back to where they should be.
What is Learning Loss?
Learning loss refers to the loss of student learning that took place due to COVID-19. The nature of distance learning caused students everywhere to experience learning in an unprecedented way, and it created many challenges. Of key importance to keep in mind is that some students have been more impacted than others. The most severely impacted are students from vulnerable populations. This includes, but is not limited to, students from low-income backgrounds, English language learners, students of color, and students with disabilities. Initial studies published in California (Pier et al., 2021) and Texas (Dorn et al., 2000) document substantially lower performance on both reading and mathematics assessments with students in these vulnerable populations, demonstrating a significantly larger learning loss than their peers. Additionally, note that students with disabilities have often been left out of the studies that document learning loss. This means that these students may be even more profoundly impacted than is being seen. Students with disabilities were also more likely than peers to experience chronic absenteeism and report feeling disconnected to their peers, teachers, and schools during COVID distance learning. This may have big consequences with the return to in-person school.
Although most students continued to make learning gains during this time period, their rate of growth failed to match patterns of growth from previous years, suggesting that schools need to help students get back on track. It is of paramount importance to address learning loss and look at learning recovery. To do this, pandemic recovery initiatives need to consider who needs help, in what areas they need help, and how much help they need. This will vary among communities, as all communities have been impacted in different ways. As a result, recovery means different things for various places. We must understand local needs and think about what particular student groups might need more help in their local context.
Different Ways Learning Loss Can be Observed
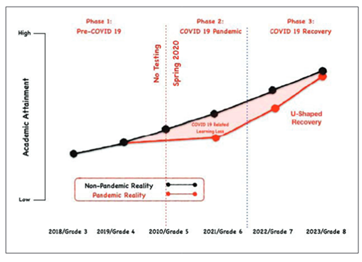
Below are visualizations of student growth over time. The following four graphs depict four possible predicted learning growth paths regarding recovery from pandemic learning loss. On the following graphs, the black dots depict students' expected learning growth over time in normal learning circumstances. In other words, it is baseline student data and the projected learning trend without the influence of a pandemic. The red dots depict predicted learning growth in terms of recovery from the pandemic under four scenarios.
1) No Recovery

The first scenario pictured represents the learning loss that occurred due to the pandemic and no recovery to where learning levels should be. The lost ground due to COVID is not made up, and learning loss continues as student performance proceeds to drop even after the return to in-person schooling. This is a system in deep trouble.
2) Some Recovery

This second scenario represents the same learning loss as a result of the pandemic but with the return to in-person learning, Notice that growth is improved. However, the improvement is still not closing the gap to where learning levels should be. This is a more hopeful scenario, but it is not a recovery; there is much more work required.
3) Slow Complete Recovery
The third scenario depicts a gradual recovery to near pre-pandemic learning outcomes over the course of three years. This is a hopeful scenario, as students are eventually catching up to where they would have been had they been receiving normal in-person instruction.
4) Quick Complete Recovery

Lastly, this fourth scenario represents a quick recovery to pre-pandemic learning levels. The learning loss was experienced over the COVID distanced learning period but upon returning to school, learning was accelerated and students were able to catch up. This is a very hopeful scenario as a quick recovery is made to expected learning levels.
What is Learning Recovery?
In recovery of students back to expected learning levels, it is important to document the rate of recovery by analyzing changes in learning trajectories (both level and slope), as initiatives related to pandemic recovery are implemented. These initiatives consist of offering incentives, doing professional development, mentoring, after school learning initiatives, or anything you might be doing to help students catch up. To see how recovery is affected, a comparison is needed between the students who are receiving the initiatives to the students who are not. This allows you to analyze the impact of district initiatives on learning trajectories of students. Note that it is also crucial that if you are looking at various student groups you have earlier clustered (EL, homeless, disabilities, 504 plans, etc.), you want to be able to make sure all students are benefiting from the district's offerings.
Learning loss everywhere has occurred, and pandemic recovery initiatives need to consider who needs help, in what areas they need help, and how much help they need. It is going to be an ongoing process documenting how much has been lost and for whom. To answer these questions, you must have access to sufficient data: historical data documenting learning in the past, as well as current data to document learning growth post pandemic. With easyCBM® and additional useful reports, such as the “benchmark grade level score report,” you can compare how students are doing in terms of risk level across various benchmarks. For example, in looking at word reading fluency, you could see raw scores, percentile ranks, and where students fell in terms of the national norms of word reading fluency. easyCBM® can document the learning loss as a result of the pandemic and more importantly, guide your recovery efforts.
Watch easyCBM author Dr. Julie Alonzo discuss these recovery scenarios and show how to interpret data from your easyCBM reports to help get your students on the path to growth