


Group comparisons are a good way to help you determine if any one student’s results are typical compared to her/his peers in the same classroom, same school, and across the school district. Consider the inquiries below when reviewing your own growth outcome data:
- If Mia and many of her peers met or exceeded their original estimated growth for a typical school year, would it be fair to qualify virtual learning program implementation as very successful because students continued to grow as expected after the mode of instruction was changed from in person to virtual?
- If Mia and many of her peers did not meet their original estimated growth for a typical school year, but did meet their estimated growth when adjusted for school closure, would it be fair to qualify virtual learning program implementation as somewhat successful because there was still some growth observed after the mode of instruction was changed from in person to virtual?
- If there are variances in growth data and students are meeting their original estimated growth in one academic domain like Math, while not meeting their adjusted estimated growth in another like Reading, would it be fair to qualify virtual learning program implementation as having mixed results, or dependent on the academic domain being taught?
- If the pattern varies and some classrooms/sections had much higher percentages of students meeting/exceeding either growth estimate, would it be fair to qualify the success of virtual learning program implementation as having mixed results based on the approaches and techniques put in place by a certain classroom teacher?
- If the pattern varies and some schools had much higher percentages of students meeting/exceeding either growth estimate, would it be fair to qualify the success of virtual learning program implementation as having mixed results based on the approaches and techniques put in place by a certain school?
- If the pattern varies and middle/high school students had much higher percentages of students meeting/exceeding either growth estimate than early elementary students, would it be fair to qualify the success of virtual learning program implementation as having mixed results based on the age or grade level of students?
Before answering with a resounding “yes!” to those prompts, let’s revisit what we meant earlier when we wrote “when interpreted carefully by ruling out unrelated factors unrelated to school closure that may have influenced Mia’s growth, actual growth beyond this point may be attributed to the relative success of the virtual learning program.”
The interpretive models that we’ve outlined all use an observed data point from the past to predict future student growth. In Mia’s case, that test administration was from fall 2019. The models further assume that Mia was growing as estimated until March 2020 when her school closed.
In practice, you may be using a test administration from Spring 2019 to predict future growth because your Spring 2020 testing program was cancelled. This means that summer 2019, a full year of mixed at school/virtual learning, and summer 2020 have passed before data from your current Fall 2020 test administration is available to compare estimated growth with observed growth. In order to make statements about the impact of school closure on student growth or the relative success of virtual learning program implementation based on growth data, you should rule out the possibility that other factors caused the trends in student growth data. Reflect on whether there are strong indications that students were not growing as expected prior to the point of school closure. If these indications exist, you’ll need to be cautious about attributing any growth outcomes to school closure or the relative success of virtual learning.
- Review results from benchmark assessment programs to determine which students were growing at levels consistent with their peers all along,
- Examine less formal progress reports for indicators, and
- Consider the effects of behavioral or social-emotional factors, or new and different curriculum or school programs that were introduced along the way.
Case Study #2: Classroom Level Results
While we were discussing Mia’s growth outcomes in the first study, you may have wondered how her results compared with those of her classroom peers. The following comparison will help you understand if Mia’s results are typical of her classmates. You’ll recall that while Mia did not meet her estimated growth in a typical school year (6-month delay), she exceeded her estimated growth when it was adjusted for school closure (no delay).
Figure 6 below is a sample of a Class Roster Report for the Iowa Assessments™ for Reading. Two new scores are now available on this report for Fall 2020:
- EGD (TSY): Estimated Growth Delay, Typical School Year
- EGD (SCA): Estimated Growth Delay, School Closure Adjusted
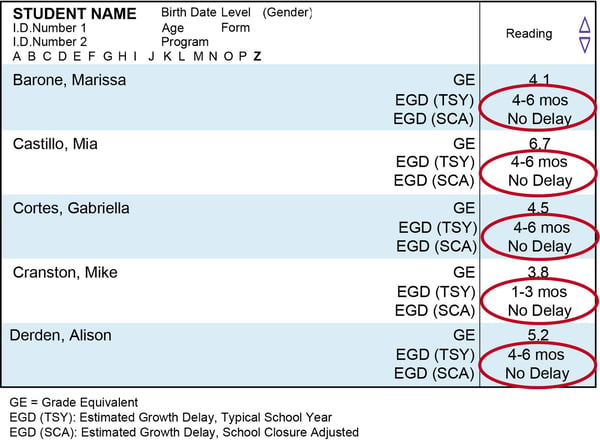
Figure 6
Can you tell from the data if Mia’s growth outcomes were typical compared to her classmates?
The figure shows that Mia’s outcomes are quite typical among her peers. None of the five reported students met their original growth estimates. Four of five had delays like Mia’s (4-6 months). One had a delay of 1-3 mos. Also, like Mia, none of these classmates were delayed when their estimated growth is adjusted for school closure.
Another way of presenting the data is in a classroom summary graph format as shown in Figure 7. This is a new report that we’ll offer for your Iowa Assessments program for this fall. It is called “Estimated Growth Summary, Early School Closure Edition.” The purpose of the summary is to display a comparison of the two different types of delay that we’ve discussed thus far:
- Growth delay in a typical school year
- Growth delay in a school closure interrupted year
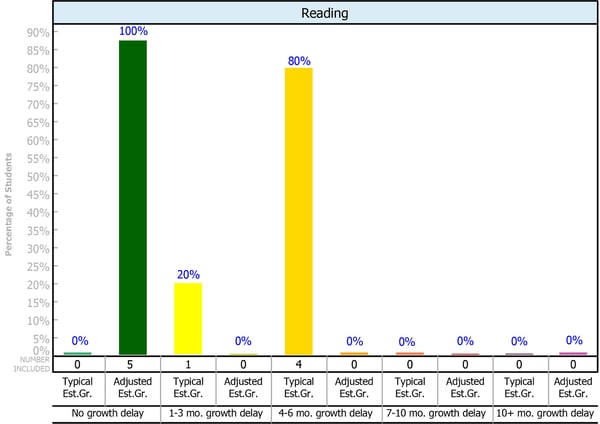
Figure 7
On this report, data are segmented into the intervals of No delay, 1–3 month delay, 4–6 month delay, 7–10 month delay, and 10+ month delay. The first green bar in the graph shows that 0% of students from Figure 6 showed “No delay” from their estimated growth in a typical year – they all have a delay of at least 1 month for a typical year. The second green bar shows that 100% of students showed no delay from their estimated growth when adjusted for school closure. This means that if expected growth was stopped in March, these students still continued to grow. Scanning from left to right in the graph, 20% of students had a 1–3 month delay in growth relative to a typical year. Because of the small class size used for our case study, this is one student. A quick look back at the roster in Figure 6 confirms this as Mike Cranston. The remaining four students (Marissa, Mia, Gabriella, Alison) were all delayed 4–6 months.
The next part of the series continues with Aggregating and Comparing Results Across Groups: Classroom (cont.), Grade Level, and Content Area Comparisons.

.jpg)