


Each of the topics covered so far are intended to help you understand how to leverage the Iowa Assessments growth model to answer questions about the impact of school closure on student growth and assesses the overall effectiveness of virtual learning programs so that you can make iterative changes to improve programs this school year. Now we will address the last series of questions presented in the introduction:
All matters of growth and virtual learning aside, where are we now? Where do we start?
- What does average achievement to start the year look like compared to past years?
- Do we have a gap to close?
- What can we do to address it?
We saw that Mia and her classmates were all delayed from the growth in achievement expected in a typical school year. What is next is the acknowledgement that estimated growth, observed growth , and the difference s are a separate consideration from students’ overall level of achievement.
Let’s view Mia from Case Study #1 through a completely different lens. Mia’s Standard Score from fall testing as a third grader was relatively high. Her score of 210 put her in the 92nd percentile nationally. Despite the delays noted in her growth relative to what was estimated for a typical school year, her score of 226 for fall testing as a fourth grader puts her in the 88th percentile. She remains high achieving and should be well suited to thrive in fourth grade. Looking through this lens, we see that rate of growth and achievement level are distinct characteristics and independently measurable just like height and weight.
Mia’s delay of 4-6 months in reading growth was greater than that of her classmate Mike’s delay of 1-3 months in Case Study #2. However, when you compare their Grade Equivalent (GE) scores, Mia is generally a higher-achieving student. Mike’s GE of 3.8 in the fall of grade four is slightly below grade level, while Mia’s GE of 6.7 is well above grade level. In Mike’s case, the goal of future academic growth may be to get him achieving at or above grade level, which means he will need to exceed his estimated growth, not just meet it.
Case Study #6: Identifying and Addressing Gaps
Due to spring school closings, it is realistic to project that the average achievement level of incoming grade groups may be lower than in the past. To help you better examine the average achievement level of incoming grade level groups compared to grades in the past:
- Run the existing Group Profile report in DataManager.
- Select Longitudinal Line Graph from the Display Type menu.
- Select Same Grade, All Students from the Longitudinal Types menu.
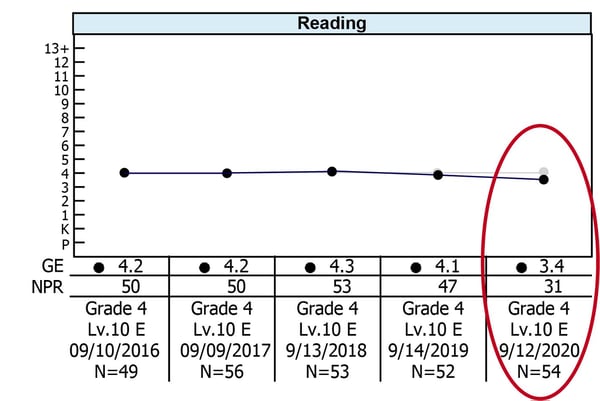 Figure 11
Figure 11 shows one example of a back-to-school scenario with a comparison of the average achievement of the last five incoming fourth grade groups. Note that while the pattern of the past four incoming groups in this example has been consistent, with average student performance falling between the 47th–53rd percentile nationally, this year’s incoming group of fourth graders has noticeably lower average achievement level at the 31st percentile nationally.
Reviewing these trends for each school and each grade will give you a good starting point for identifying how much of a gap incoming groups have relative to the past. Once you have identified a gap, you can use the skill domain and item analysis data to build an effective plan for closing the gap. Even if your virtual learning program was highly successful and you see incoming achievement consistent with the past, the same process will help you identify patterns of academic strengths and weakness and build targeted instructional plans.
Figure 12 shows that the incoming group of fourth graders is below the national average in each of five reported reading skill domains. To review this data:
- Run the existing Group Profile report in DataManager.
- Select Skill Domain Analysis from the Display Options menu.
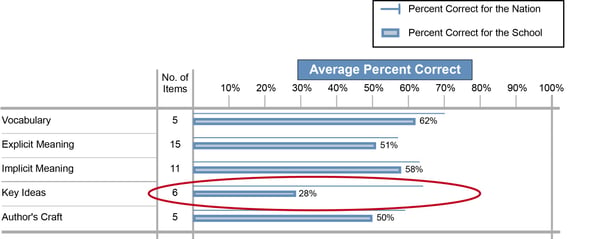 Figure 12
Reviewing this example, we see that Key Ideas is a noteworthy weakness relative to the other domains. This school’s average score on the cluster of items measuring Key Ideas is 28%, while the blue line above the bar indicates the national average is over 60%. Based on this information, Key Ideas should be a focus area of Reading instruction early in the year.
Figure 13 illustrates how you can further target the more discrete content within each skill domain. This report is the Group Item Analysis (Scoring Service Print Style), selected from the Display Type menu within DataManager. The pattern shown here indicates that students are struggling much more with “Central ideas & their support” than with “Connecting/ extending ideas.” This presents an even narrower focus for Reading instruction early in the year.
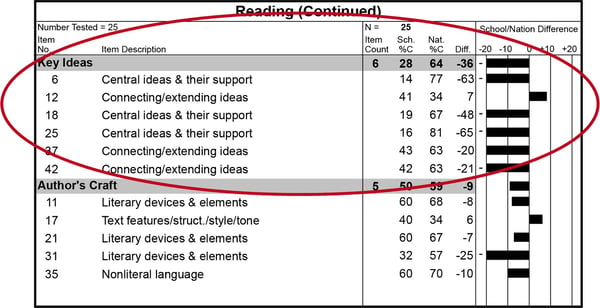 Figure 13

.jpg)