


Remember last spring? It seems like years ago for most of us. Unprecedented school closures across the world forced you and your colleagues to design and implement virtual learning programs. You thought quickly. You acted quickly. You didn’t have any time to define what success with virtual learning meant, and even if you did define it, you probably didn’t have much of a toolset to adequately measure it. There were a lot of unanswered questions at the end of the year. Your end-of-year formative assessments were cancelled. State-wide summative programs were cancelled too. The data from those measures are what helps you and your peers answer the question “how’d we do?”
Now it’s time to head back to school. You had a little more time for planning over the summer, but the uncertainty surrounding the pandemic remains and unanswered questions remain as well. This blog series is intended to help you understand how the Iowa Assessments™, which are designed to measure student growth and help evaluate the efficacy of instructional programs, can help you answer those questions this fall. In this post and the next 3 installments we will guide you through questions like:
- What was the effect of last spring’s school closures on student growth?
- To find out, keep reading this article.
- Check out: COVID-Slide Report: Aggregating and Comparing Results Across Groups
- How effective was the virtual learning program that we put in place, and what can change this year?
- Did virtual learning work better for some students than for others?
- Did some classrooms execute better than others?
- Did it work better in some grades than others?
- Did it work better for some academic domains than others (e.g., reading vs math)?
- Did some schools execute better than others?
- All matters of growth and virtual learning aside, where are we now? Where do we start?
- Check out: COVID-Slide Report: Where are we now?
- What does average achievement to start the year look like compared to past years?
- Check out: COVID-Slide Report: Where are we now?
- Do we have a gap to close?
- Check out: COVID-Slide Report: Where are we now?
- What can we do to address it?
- Check out: COVID-Slide Report: Where are we now?
Measuring Growth with Research-based Assessments
The Iowa Assessments are vertically aligned and scaled. This means that each successive test level builds upon the content and skills previously measured to ensure that tests taken over multiple grade levels show a coherent progression in learning. Each test level is developed for a different target grade level, but always relates the results of student growth and progress using the same scale. This way you can be assured that the changes in test scores over time convey the change in your students’ achievement and not differences in the test or the pacing of instructional concepts across units or grade levels.
This makes the Iowa Assessments growth model ideally suited to help you answer those important back to school questions.
Estimated Growth and Observed Growth
The models and approaches used to measure student growth can be complex. At times, it may be hard for you to answer the seemingly simple question “How is a student growing in relation to other students, and is the growth that they have achieved in line with what is expected?”
The Iowa Assessments vertical score scale—the Standard Score (SS)—spans a developmental continuum from Kindergarten to Grade 12. The scale enables estimation of expected student growth of your students based on one test administration to the time of the next planned test administration. This comparison is tremendously insightful if you are administering the Iowa Assessments early in the fall and then again late in the spring (pre- and post-testing), but also works very well if you are administering the assessments once annually or every other year. The following approaches are still valid even if your last Iowa Assessments administration was in spring 2019 because last year’s spring testing was cancelled. We will discuss that topic in more detail later.
When each of your students’ estimated growth is compared to the scores from your next test administration, student growth can be distilled into three easy-to-understand outcomes:
| Estimated Growth Outcome | What Does it Mean? |
| A student exceeded their estimated growth |
S/he is outpacing other students |
| A student met their estimated growth | S/he is keeping pace with other students |
| A student did not meet their estimated growth | S/he is falling behind other students |
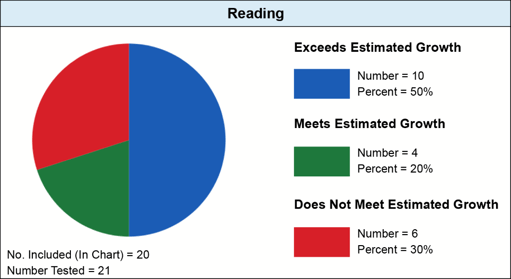
If you are using the Iowa Assessments in your school, you will be familiar with the graphic shown in Figure 1 here. It is the Estimated Growth Summary report available in DataManager. This report aggregates the percent of students for each of the three outcomes at class, school, and school system levels.
Figure 1 shows that 50% (n=10) of students in a class exceeded their estimated growth, 20% (n=4) of students met their estimated growth, and 30% (n=6) did not meet their estimated growth for Reading.
For students not meeting their estimated growth, the Iowa Assessments can also provide details on how many months delayed they are from meeting the growth estimate.
| Months Delayed Outcome | What Does it Mean? |
| A student is 1-2 months delayed | S/he was delayed by 1-2 months from meeting her/his estimated growth |
| A student is 3-4 months delayed | S/he was delayed by 3-4 months from meeting her/his estimated growth |
| A student is 5-6 months delayed | S/he was delayed by 5-6 months from meeting her/his estimated growth |
| A student is +6 months delayed | S/he was delayed by greater than 6 months from meeting her/his estimated growth |
The Impact of Widespread School Closure
No one could have predicted that schools around the nation would be forced to close due to health concerns from the coronavirus pandemic. We have outlined how student growth can be estimated and compared to actual growth, but you probably have questions about how estimates can and should change because of school closure, and whether the same approach can be used moving forward.
For back-to-school this fall, we introduced a new version of the Estimated Growth Summary to help you understand the impact of school closure on student growth, and to help you answer the important questions that we introduced at the beginning. We will walk through several case studies to help you understand how to interpret this information in the new report. These case studies include data scenarios for illustrative purposes only. The results and trends that you see in your own data may be different.
Case Study #1: Individual Student Growth
Figure 2 below represents the estimated rate of growth in reading for Mia Castillo. She was a third grader for the 2019-2020 school year. Mia is a relatively high-achieving student, and like many students, her school closed in March of 2020. She achieved a Standard Score of 210 on the Iowa Assessments in September 2019. If Mia grows at a rate consistent with her peers throughout the nation, her score is estimated to be 233 when she takes the Iowa Assessments again in the fall as a fourth grader. Her estimated growth is 23 Standard Score points (233 – 210).
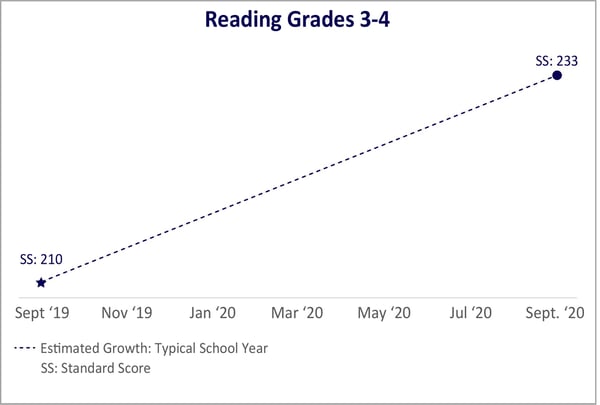
Figure 2
Using the Iowa Assessments' vertical scale allows us to pinpoint the second week in March 2020 when schools closed to estimate what Mia’s score should have been at that time. Figure 3 below shows that this estimate is 223, or 13 Standard Score points (223 – 210).
While Mia may have participated in virtual learning offered through her school, not all schools could offer a virtual learning program. Even when offered, not all students had an equal opportunity to participate in virtual learning. These factors, combined with the unexpected nature of school closures, means that there is no empirical foundation to estimate how Mia or other students should continue to grow after schools closed.
What we can do is stop any assumption on continued growth from the point in early March when Mia’s school closed until she is assessed again as an entering fourth grader. Notice in Figure 3 how this changes Mia’s estimated growth between third and fourth grade. Her growth estimate in a typical school year, represented by the navy-blue line, is 23 standard score points. Her growth estimate in this interrupted school year, represented by the royal blue line, is 13 points.
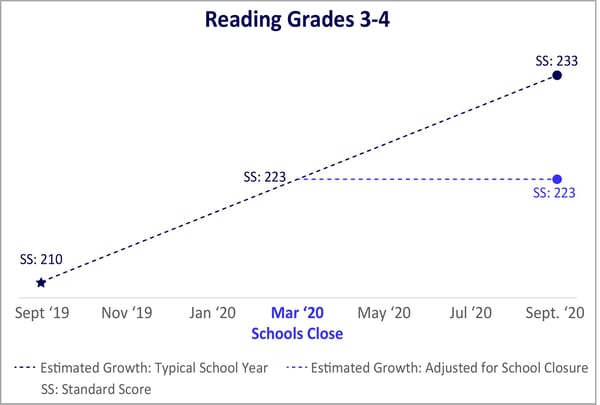 Figure 3
This new reference point, “Estimated Growth: Adjusted for School Closure,” provides insight into the impact of school closure on Mia’s growth because it assumes Mia’s achievement stopped growing when her school closed. When interpreted carefully by ruling out factors unrelated to school closure that may have influenced growth, Mia’s actual growth beyond this point may be attributed to the relative success of the virtual learning programs she attended.
Figure 4 below plots Mia’s hypothetical observed score as a fourth grader. You can see in the figure that she fell short of the growth estimated for a typical, uninterrupted school year. Her actual Standard Score of 226 is 7 points below the original estimate of 233 for her in fall of Grade 4. However, when we adjust this estimate for school closure, she surpassed the new estimate by 3 points.

Mia’s estimated growth outcome can also be represented in terms of months. Figure 5 below shows that while Mia fell six months behind her original estimated growth, she exceeded her estimated growth adjusted for school closure by 2 months.

This series continues with Aggregating and Comparing Results Across Groups: Classroom Results.
.jpg)